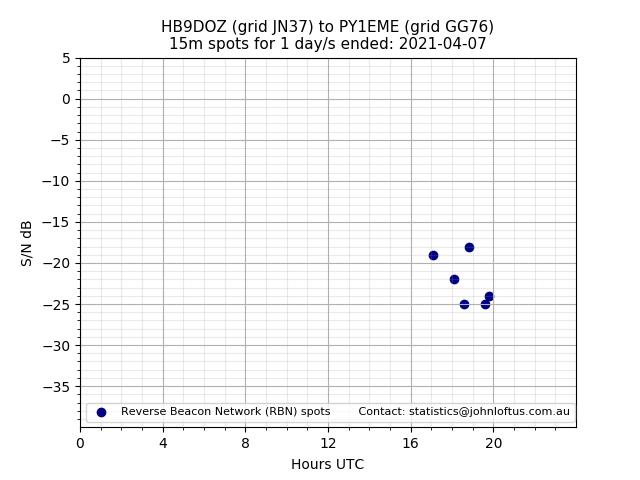
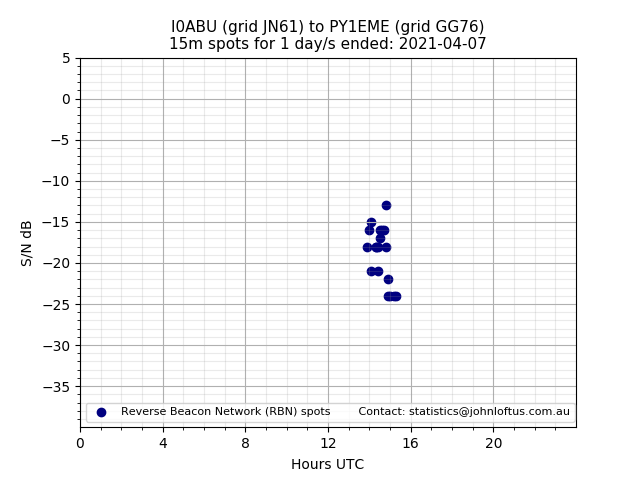
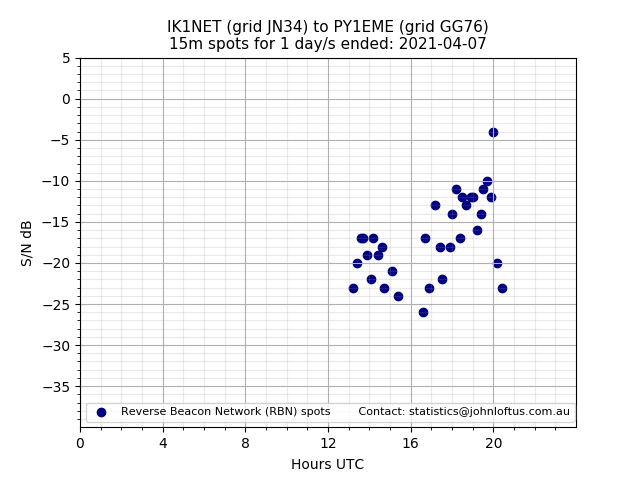
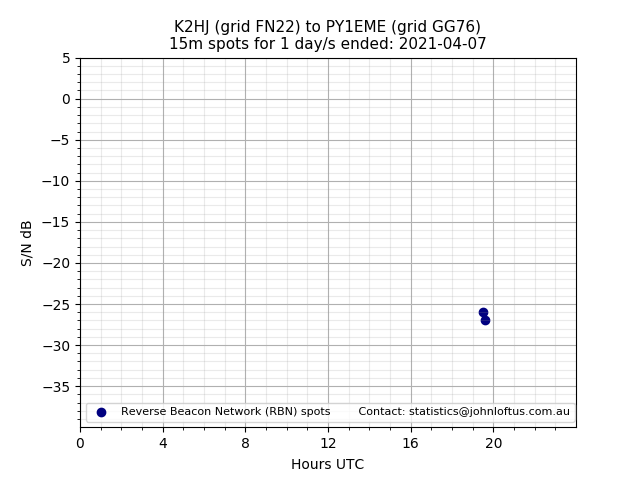
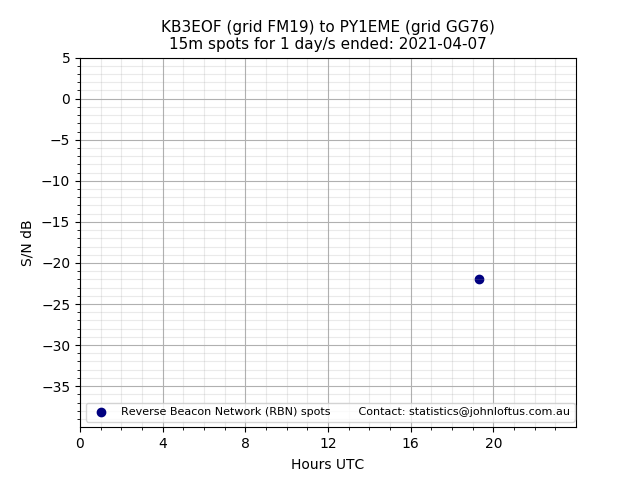
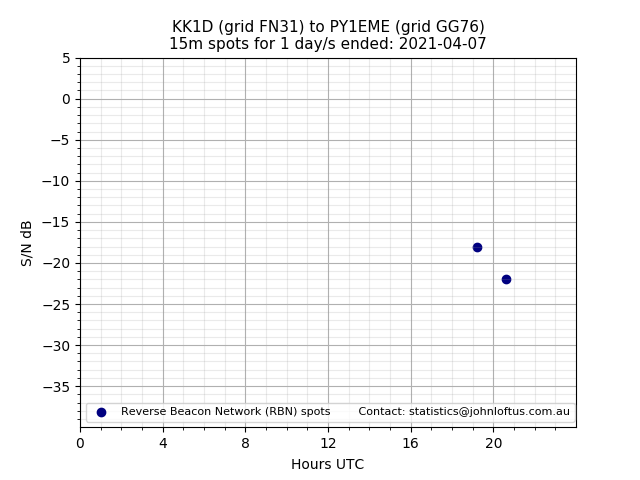
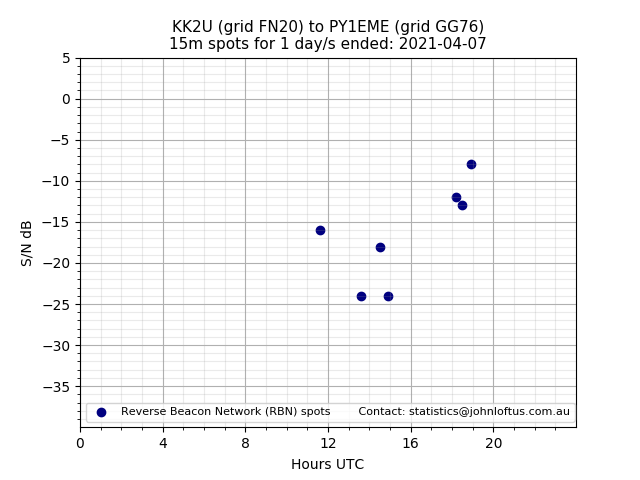
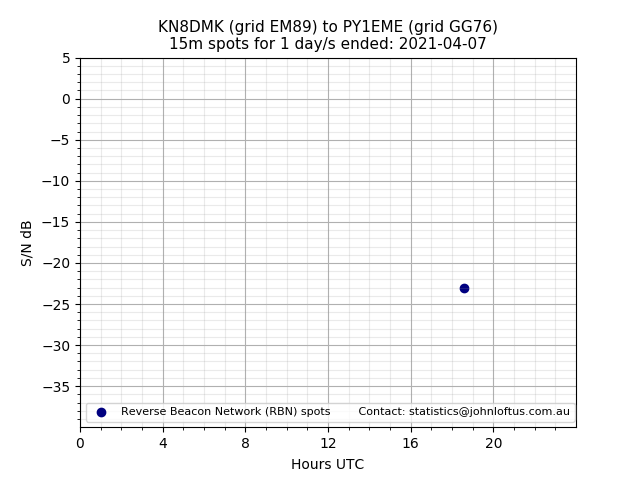
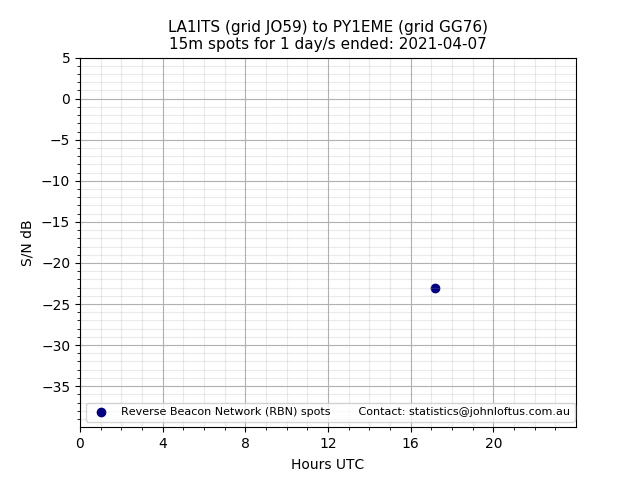
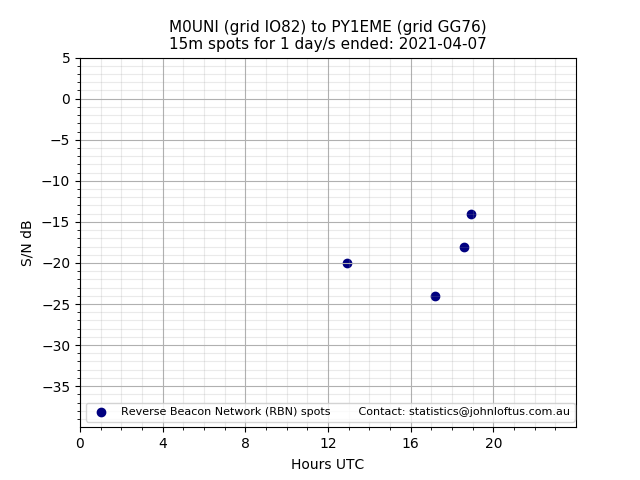
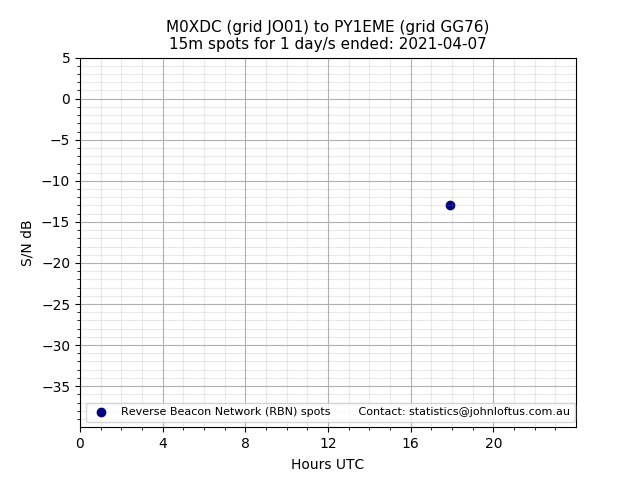
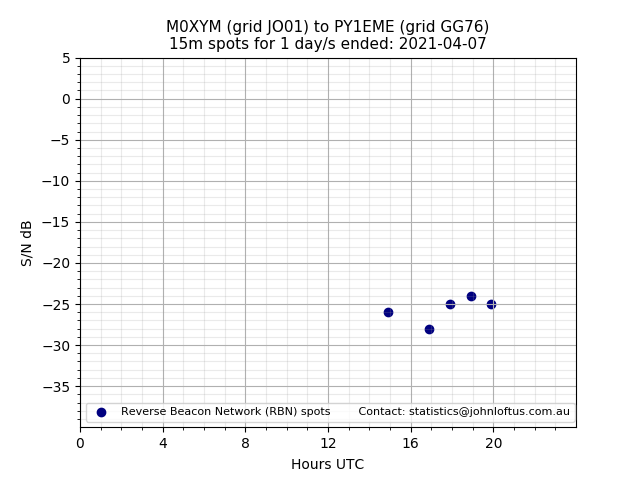
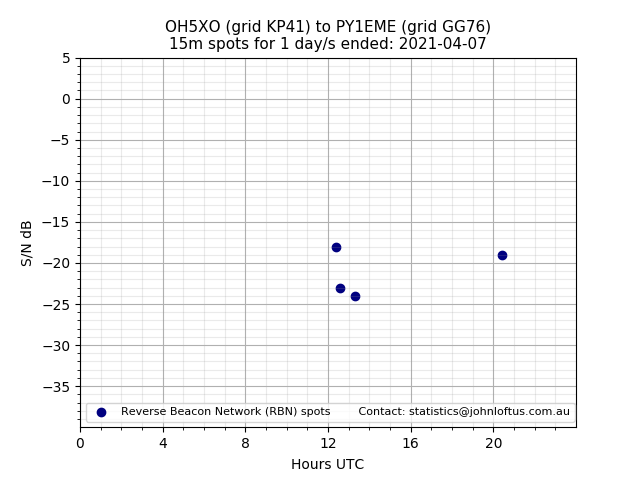
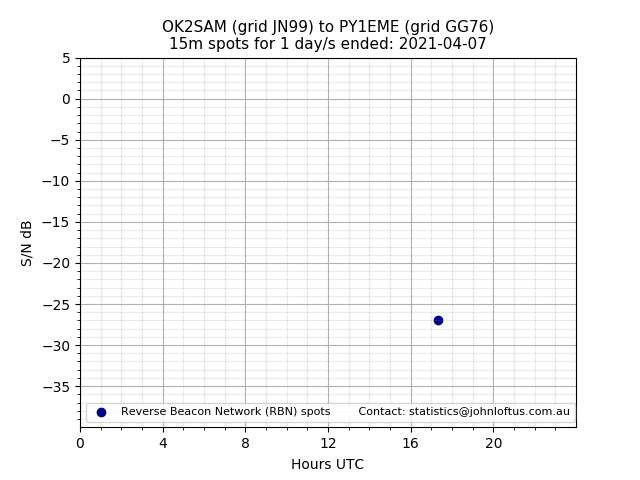
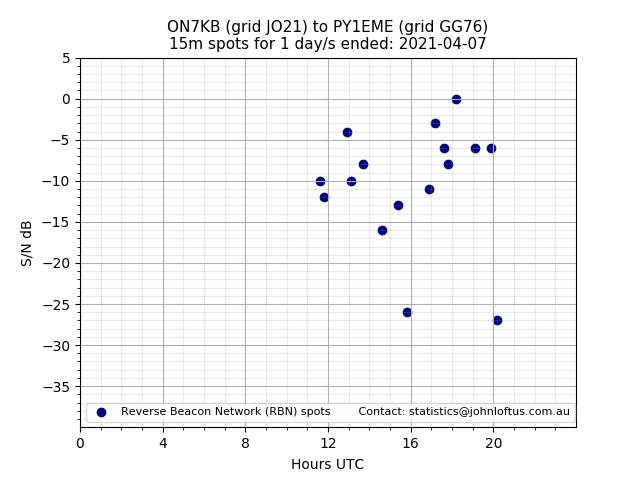
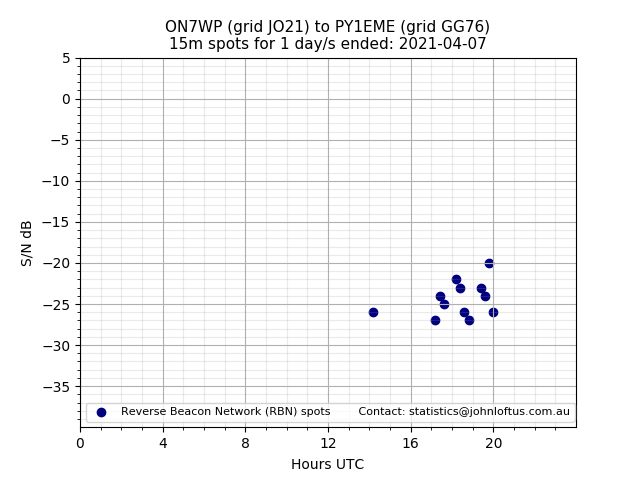
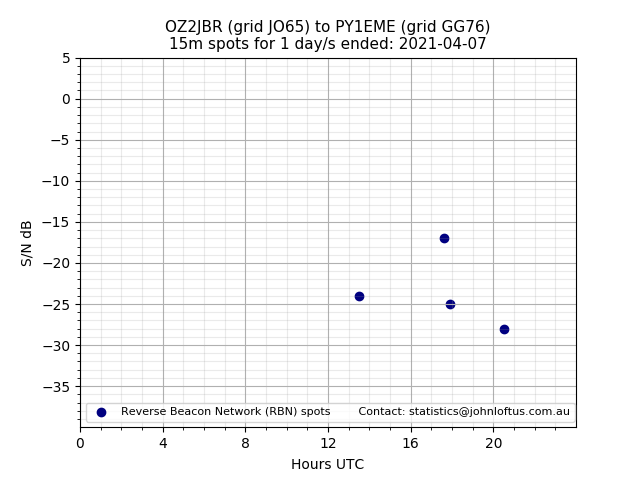
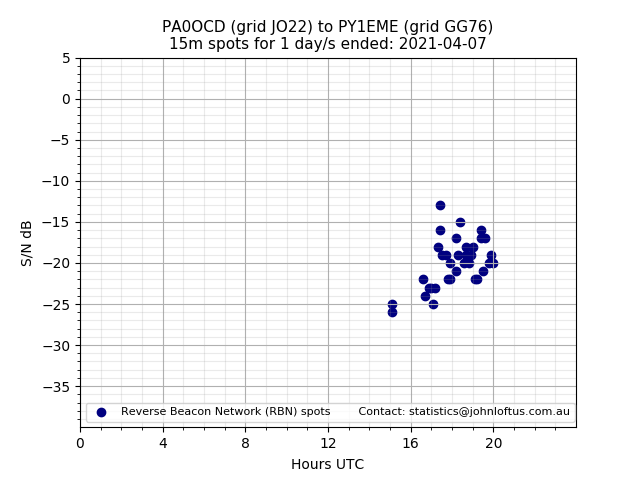
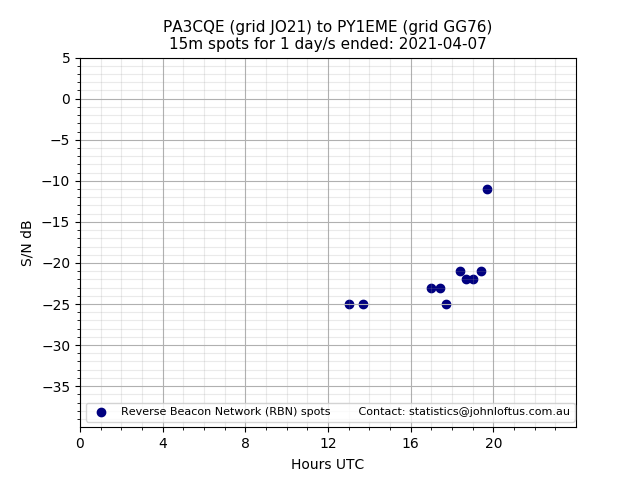
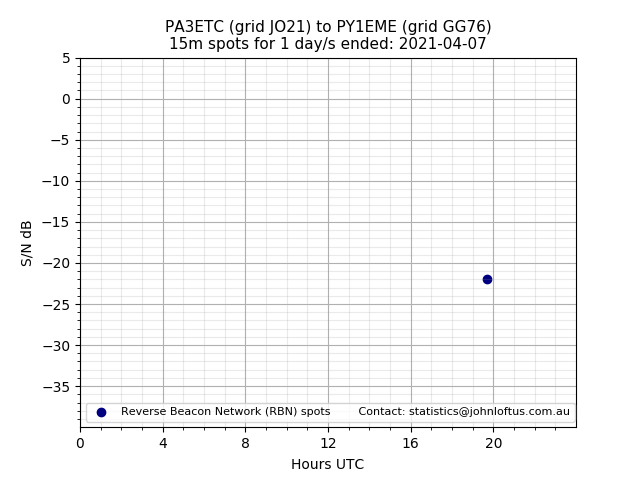
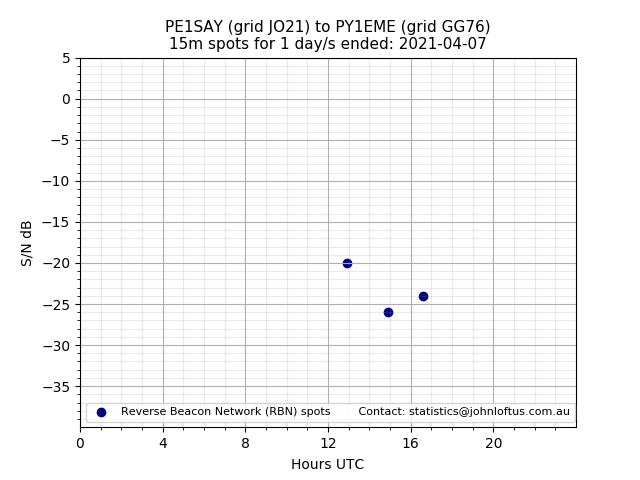
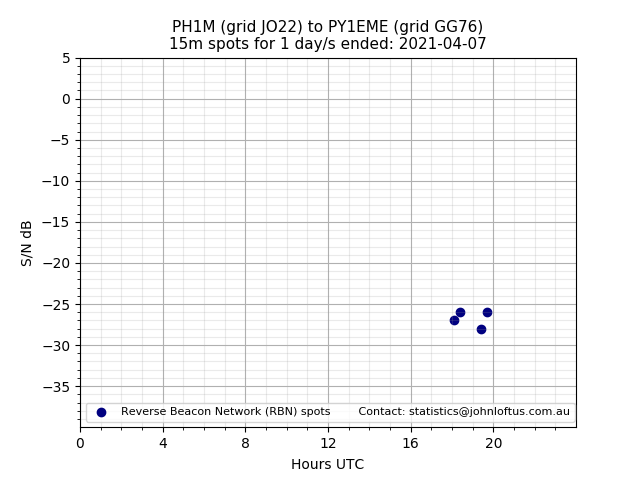
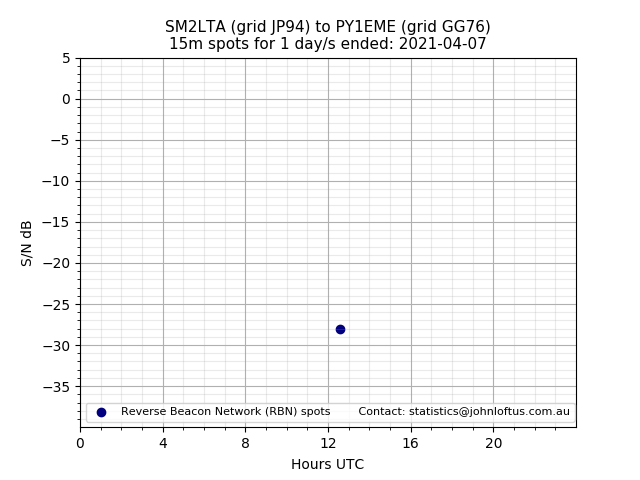
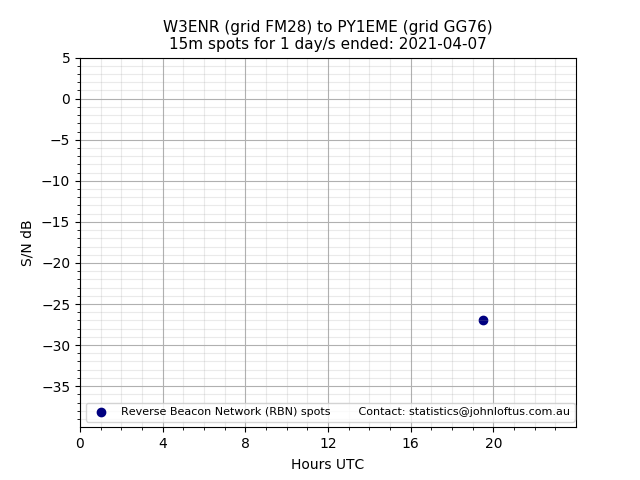
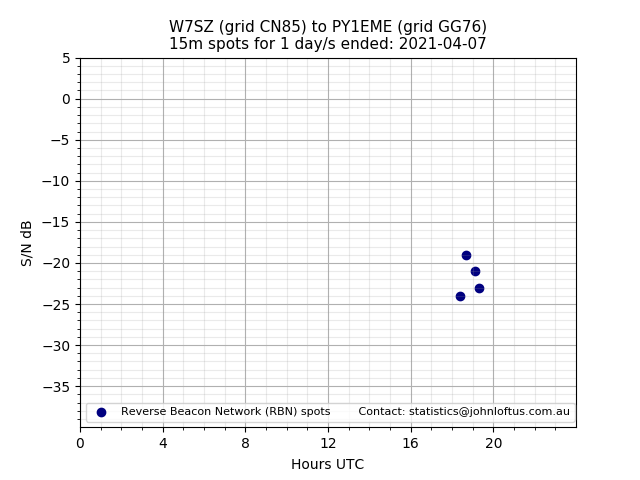
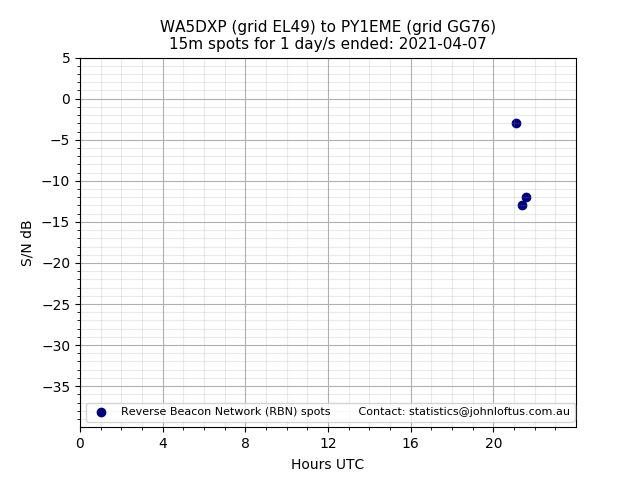
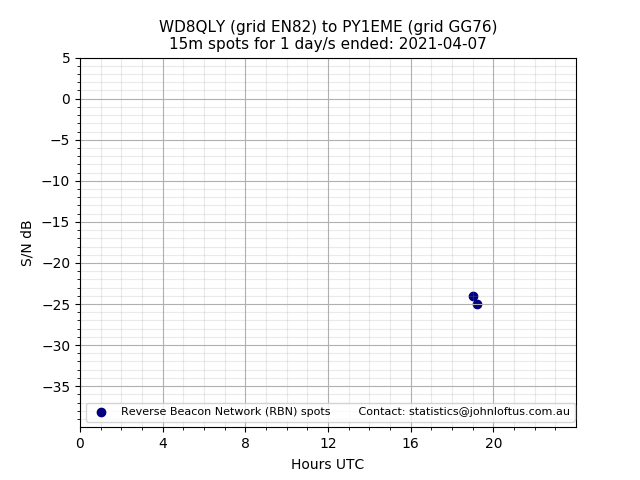
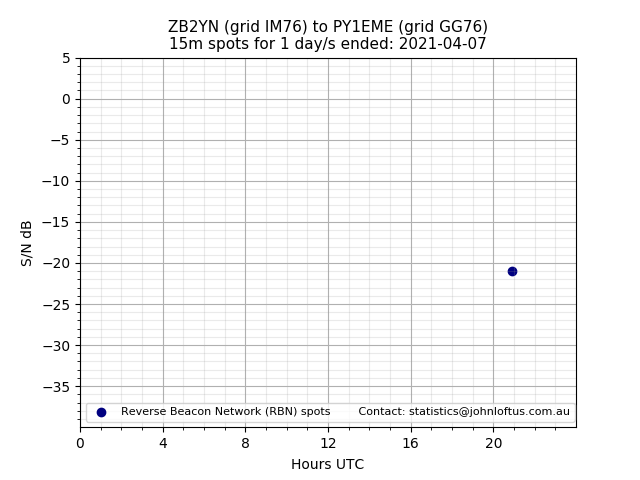
15m_band_openings


Scatter chart shows spots received from DG7RJ to py1eme during 24 hour period on the 15m band.


Scatter chart shows spots received from DG8GAD to py1eme during 24 hour period on the 15m band.


Scatter chart shows spots received from DJ4FF to py1eme during 24 hour period on the 15m band.


Scatter chart shows spots received from DJ6LB to py1eme during 24 hour period on the 15m band.


Scatter chart shows spots received from DK9ES to py1eme during 24 hour period on the 15m band.


Scatter chart shows spots received from DL1DUZ to py1eme during 24 hour period on the 15m band.


Scatter chart shows spots received from DL2WB to py1eme during 24 hour period on the 15m band.


Scatter chart shows spots received from DL4XJ to py1eme during 24 hour period on the 15m band.


Scatter chart shows spots received from DP0GVN to py1eme during 24 hour period on the 15m band.


Scatter chart shows spots received from DP0POL to py1eme during 24 hour period on the 15m band.


Scatter chart shows spots received from EA5CYA to py1eme during 24 hour period on the 15m band.


Scatter chart shows spots received from F5MMX to py1eme during 24 hour period on the 15m band.


Scatter chart shows spots received from G0IMX to py1eme during 24 hour period on the 15m band.


Scatter chart shows spots received from G4GCI to py1eme during 24 hour period on the 15m band.


Scatter chart shows spots received from G4GVZ to py1eme during 24 hour period on the 15m band.


Scatter chart shows spots received from G4ZFQ to py1eme during 24 hour period on the 15m band.


Scatter chart shows spots received from HB9AK to py1eme during 24 hour period on the 15m band.


Scatter chart shows spots received from HB9DOZ to py1eme during 24 hour period on the 15m band.


Scatter chart shows spots received from I0ABU to py1eme during 24 hour period on the 15m band.


Scatter chart shows spots received from IK1NET to py1eme during 24 hour period on the 15m band.


Scatter chart shows spots received from K2HJ to py1eme during 24 hour period on the 15m band.


Scatter chart shows spots received from KB3EOF to py1eme during 24 hour period on the 15m band.


Scatter chart shows spots received from KK1D to py1eme during 24 hour period on the 15m band.


Scatter chart shows spots received from KK2U to py1eme during 24 hour period on the 15m band.


Scatter chart shows spots received from KN8DMK to py1eme during 24 hour period on the 15m band.


Scatter chart shows spots received from LA1ITS to py1eme during 24 hour period on the 15m band.


Scatter chart shows spots received from M0UNI to py1eme during 24 hour period on the 15m band.


Scatter chart shows spots received from M0XDC to py1eme during 24 hour period on the 15m band.


Scatter chart shows spots received from M0XYM to py1eme during 24 hour period on the 15m band.


Scatter chart shows spots received from M5ADL to py1eme during 24 hour period on the 15m band.


Scatter chart shows spots received from MU0ZVV to py1eme during 24 hour period on the 15m band.


Scatter chart shows spots received from N2HQI to py1eme during 24 hour period on the 15m band.


Scatter chart shows spots received from OE1SJS to py1eme during 24 hour period on the 15m band.


Scatter chart shows spots received from OH5XO to py1eme during 24 hour period on the 15m band.


Scatter chart shows spots received from OK2SAM to py1eme during 24 hour period on the 15m band.


Scatter chart shows spots received from ON7KB to py1eme during 24 hour period on the 15m band.


Scatter chart shows spots received from ON7WP to py1eme during 24 hour period on the 15m band.


Scatter chart shows spots received from OZ2JBR to py1eme during 24 hour period on the 15m band.


Scatter chart shows spots received from PA0OCD to py1eme during 24 hour period on the 15m band.


Scatter chart shows spots received from PA0RBL to py1eme during 24 hour period on the 15m band.


Scatter chart shows spots received from PA3CQE to py1eme during 24 hour period on the 15m band.


Scatter chart shows spots received from PA3ETC to py1eme during 24 hour period on the 15m band.


Scatter chart shows spots received from PE1SAY to py1eme during 24 hour period on the 15m band.


Scatter chart shows spots received from PH1M to py1eme during 24 hour period on the 15m band.


Scatter chart shows spots received from SM2LTA to py1eme during 24 hour period on the 15m band.


Scatter chart shows spots received from W3ENR to py1eme during 24 hour period on the 15m band.


Scatter chart shows spots received from W7SZ to py1eme during 24 hour period on the 15m band.


Scatter chart shows spots received from WA5DXP to py1eme during 24 hour period on the 15m band.


Scatter chart shows spots received from WD8QLY to py1eme during 24 hour period on the 15m band.


Scatter chart shows spots received from ZB2YN to py1eme during 24 hour period on the 15m band.


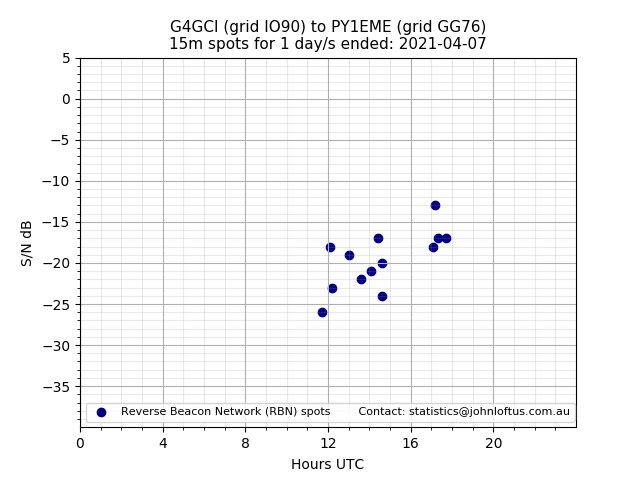
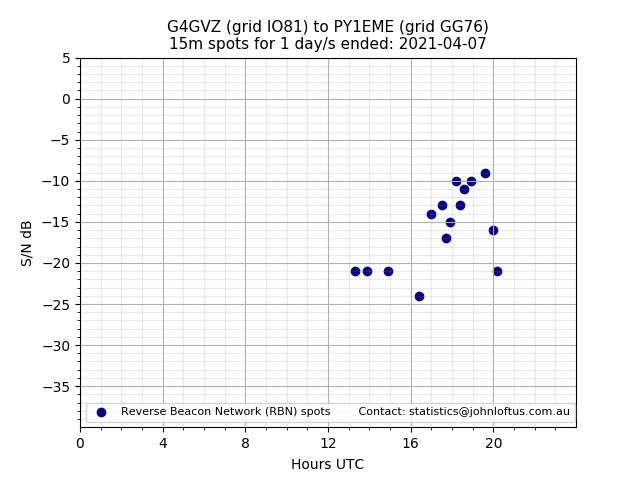
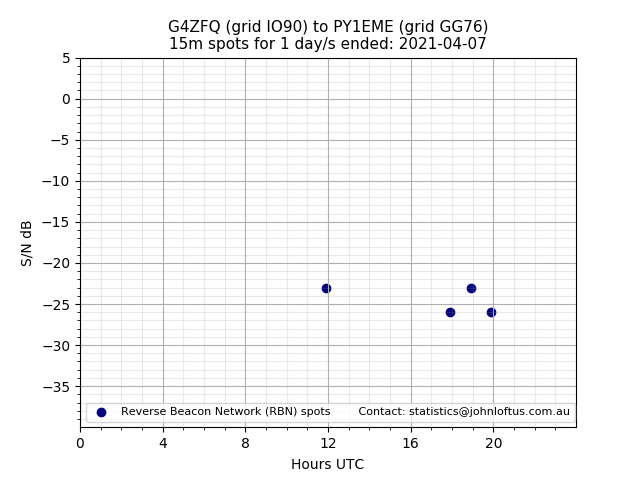
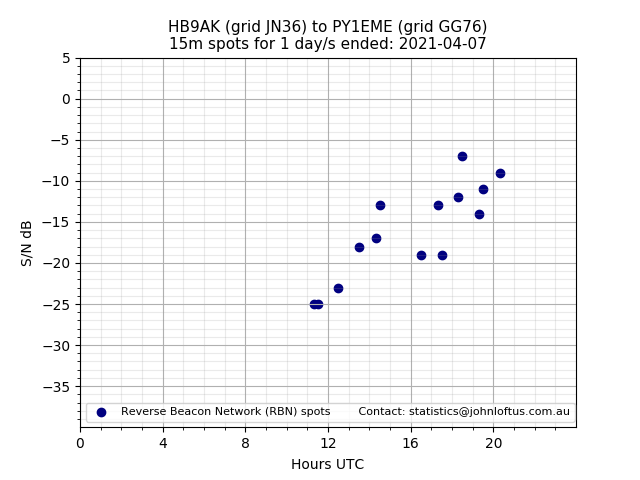
  EXERCISE.

  Apply the charts to your statistics or strategy for the next contest.

  CREDITS

  WSJT-X v2.2 Weak Signal Propagation Reporter (WSPR)

  WSPRnet Big database for study and analysis

  SPONSORS

  Radio station and charts: Bernd Langer (VK2IA) and John Loftus (VK4CT)

  .......


  Suggestions and comments are welcome.

  Contact details appear at bottom of each chart.

  .......